In one of Sir Arthur Conan Doyle’s novels, Sherlock Holmes explains to Watson that “it is a capital mistake to theorise before one has data.” It’s not uncommon for opinion and perception to hold unwarranted influence over analysis and decision making about places. In our work we have found many cases where popular opinion about local areas dictates plans and investment. However, with a boom in the availability of ‘Big Data’ and the technology to use it, it’s becoming easier to find ways to base decisions on better intelligence and insights.
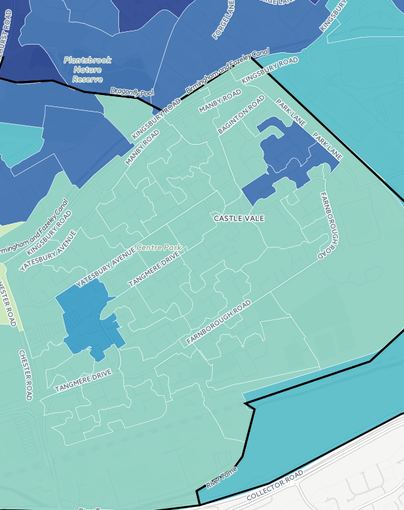
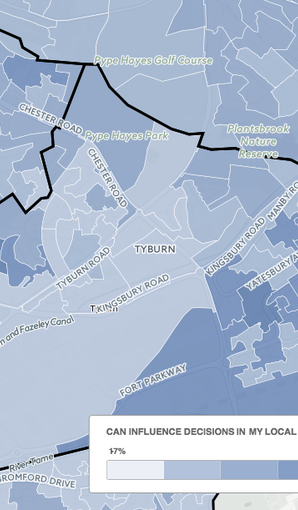
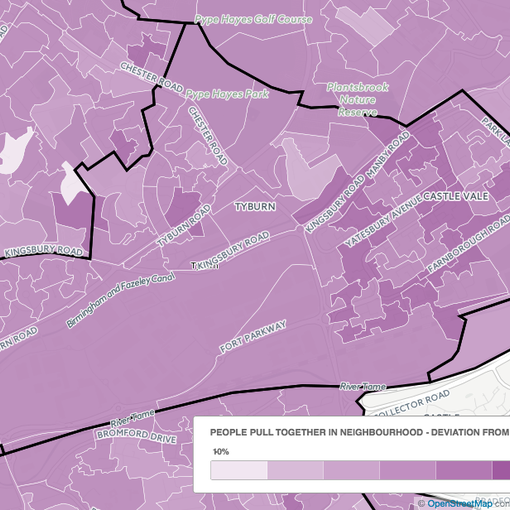
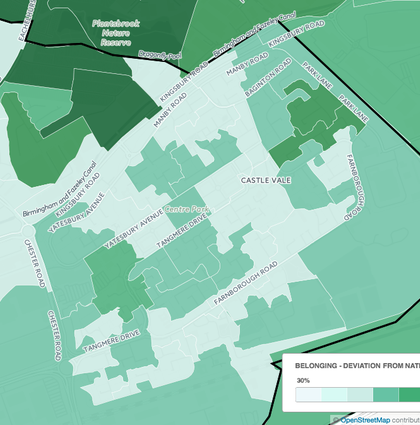
Social Life has been incorporating the use of ‘Big Data’ in a number of our recent projects. Using our social sustainability framework and publicly available national survey data from the Understanding Society Survey, we have been mapping predicted levels of belonging and local social relationships in Castle Vale, Birmingham. We use this data in many of our projects, and we are now working on how we can map and visualize this to make it more accessible.
Castle Vale Community Housing, part of the Pioneer Group, asked Social Life to explore whether this sort of predictive data about local attitudes could give them new insights into local community dynamics. Castle Vale has been through a focused period of intervention and investment over the last 20 years, and the Pioneer Group want to understand how the many changes have affected how residents feel about the place they live.
There is a large pool of national survey data to draw from in the UK, and new ways in which this data can be applied. Traditional comparable data sets and social measurement, such as IMD, tend to be used at borough, ward or lower level super output area. However, using a method developed by the Office of National Statistics to categorise small local areas by character, “Output Area Classifications”, we are able to map people’s predicted subjective experience of where they live down to very local areas, to “output areas” (around 300 people).
Our work exploring data spatially has also been made easier by the rise of easy-to-access mapping platforms, such as Carto, which we used to map this data.
Data, of course, only offers part of the story. An area like the Castle Vale Estate is complex, and we need to put actual data about residents’ perceptions alongside our predictive data to help draw out patterns of change. National survey questions can be replicated for the local area to gather comparative surveys of local opinion. Differences between predicted and actual data can be very telling. For example, it may be found that an area has stronger local relationships and sense of belonging than is expected, or that there is a strong sense of local identity.
What is it that makes a community stand out, or work better than expected? Or what is it that means a community is struggling? Exploring these kinds of questions can allow decision makers to make better decisions about the communities they are supporting, and also to take account of what is going well, as well as where the problems lie.
Social Life will be reporting more about our use of Big Data to predict local social attitudes in the next month.
Photo by Kris Davies.