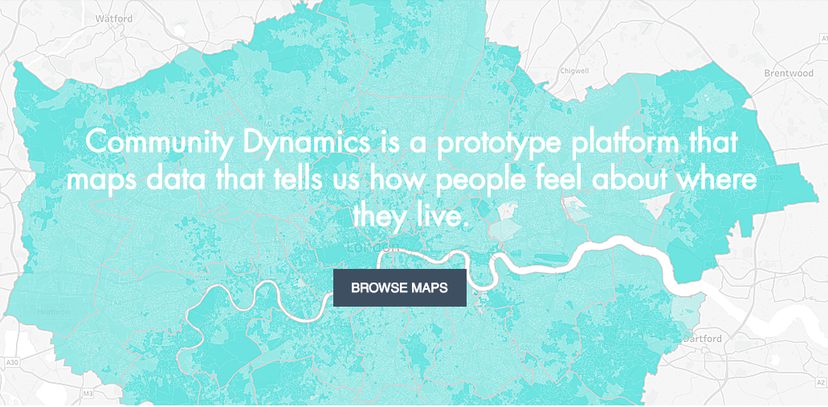
Launching our Community Dynamics website - an online prototype mapping how we feel about the places we live.
Our aim is to map data that tells us about how people are likely to feel about their everyday lives in local neighbourhoods. This adds an understanding of lived experience to the data more commonly used by local agencies, about deprivation, crime, public health and other social needs.
Social Life's work focuses on understanding the relationship between people and the places they live. We use different methods to gather data to give us insights into the complex attitiudes we often have to the places we call home.
Much of our work is qualitative, exploring the nuances and depths of our lived experience. However, we are also fascinated with the potential of hard data - gathered through surveys, from statutory data sources, or from social media or IoT - to give a different layer of understanding to our conversations and discussions.
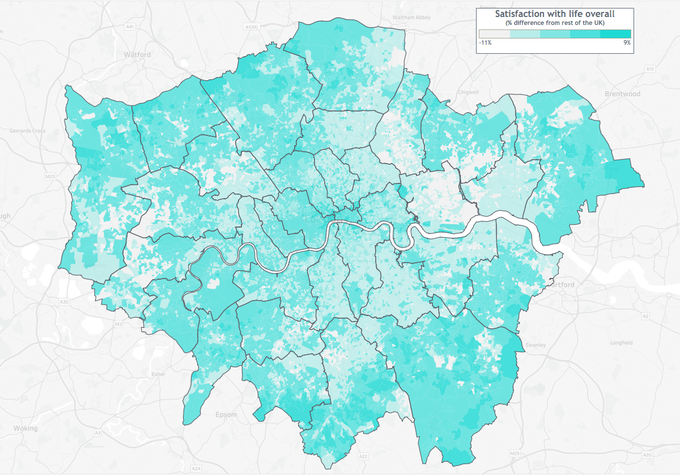
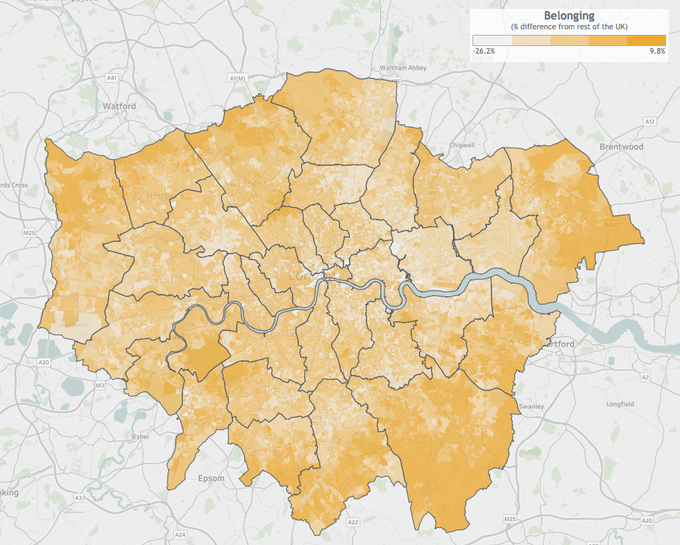
We have developed a method of matching data from national surveys to small local neighbourhoods, using ONS' Output Area Classifications. This gives us a prediction of how any small area is likley to perform. If we map data about perceptions of places - about people's trust in their neighbours, their sense of belonging, or their feelings of safety - this gives us a prediction of how people living in a local area are likely to feel about the place they call home. We call this our Community Dynamics data.
Understanding Society Survey gives us a powerful longitudinal dataset exploring different aspects of our lives. The survey includes questions about our attitudes towards places we live in or visit, and to our neighbours and others living locally.
We have mapped Understanding Society Survey data to small neighbourhoods to help with many of our our projects. This gives us a benchmark for interpreting data about the actual area. If the research reveals that attitudes are more positive than what would be expected, then we can conclude that there is something in the place that is supporting people to feel good. If the data is more negative than the benchmark, then something is undermining people's experience of the place. This helps us understand the assets and vulnerabilities of places and how these affect people's daily experiences.
We have now developed our prototype Community Dynamics wesbite.
This is the first steps in making this data available. For this initial version we have focused on London, however it is possible in future iterations to create community dynamics maps for all of England and Wales.
We hope to be able to take this work to its next stages in the next year, expanding coverage of the website to other parts of England and Wales, and adding other datasets in to create a way of comparing community dynamics with more familiar measurements of social need.