

Through our Mapping the Social City project with SIX, Social Life has collected a range of different participatory mapping examples.
In this post, María de los Ángeles Briones, a PhD student at the Density Design Research Lab at the Politecnico di Milano, takes a closer look at some of these examples, focusing specifically on the visual dimensions of these social tools.
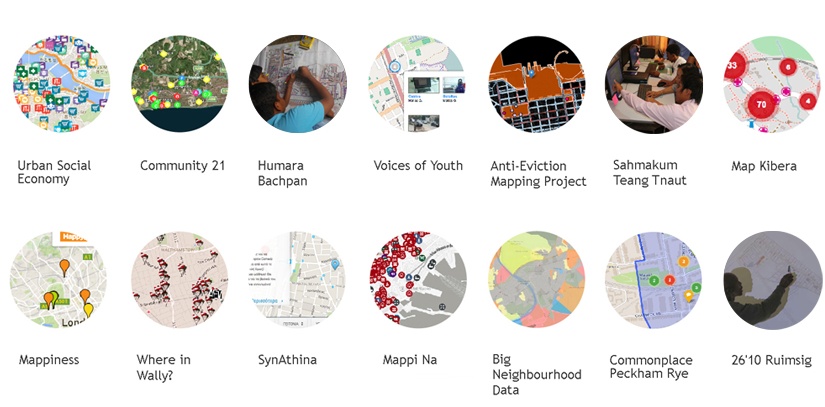
In this blog, we will use 14 different examples from different continents and contexts to explore the goals and methods used for participatory mapping as a social digital tool. Despite looking very different and coming from a range of cultural backgrounds, there are a number of similarities in these different case studies.
Although the examples have different goals, we have identified four main focus areas: activism, conviviality, networking and urban planning. More localised mapping projects often had a focus on activism. We also see from that maps are not isolated tools, they are complementary to work with other communication tools and platforms.
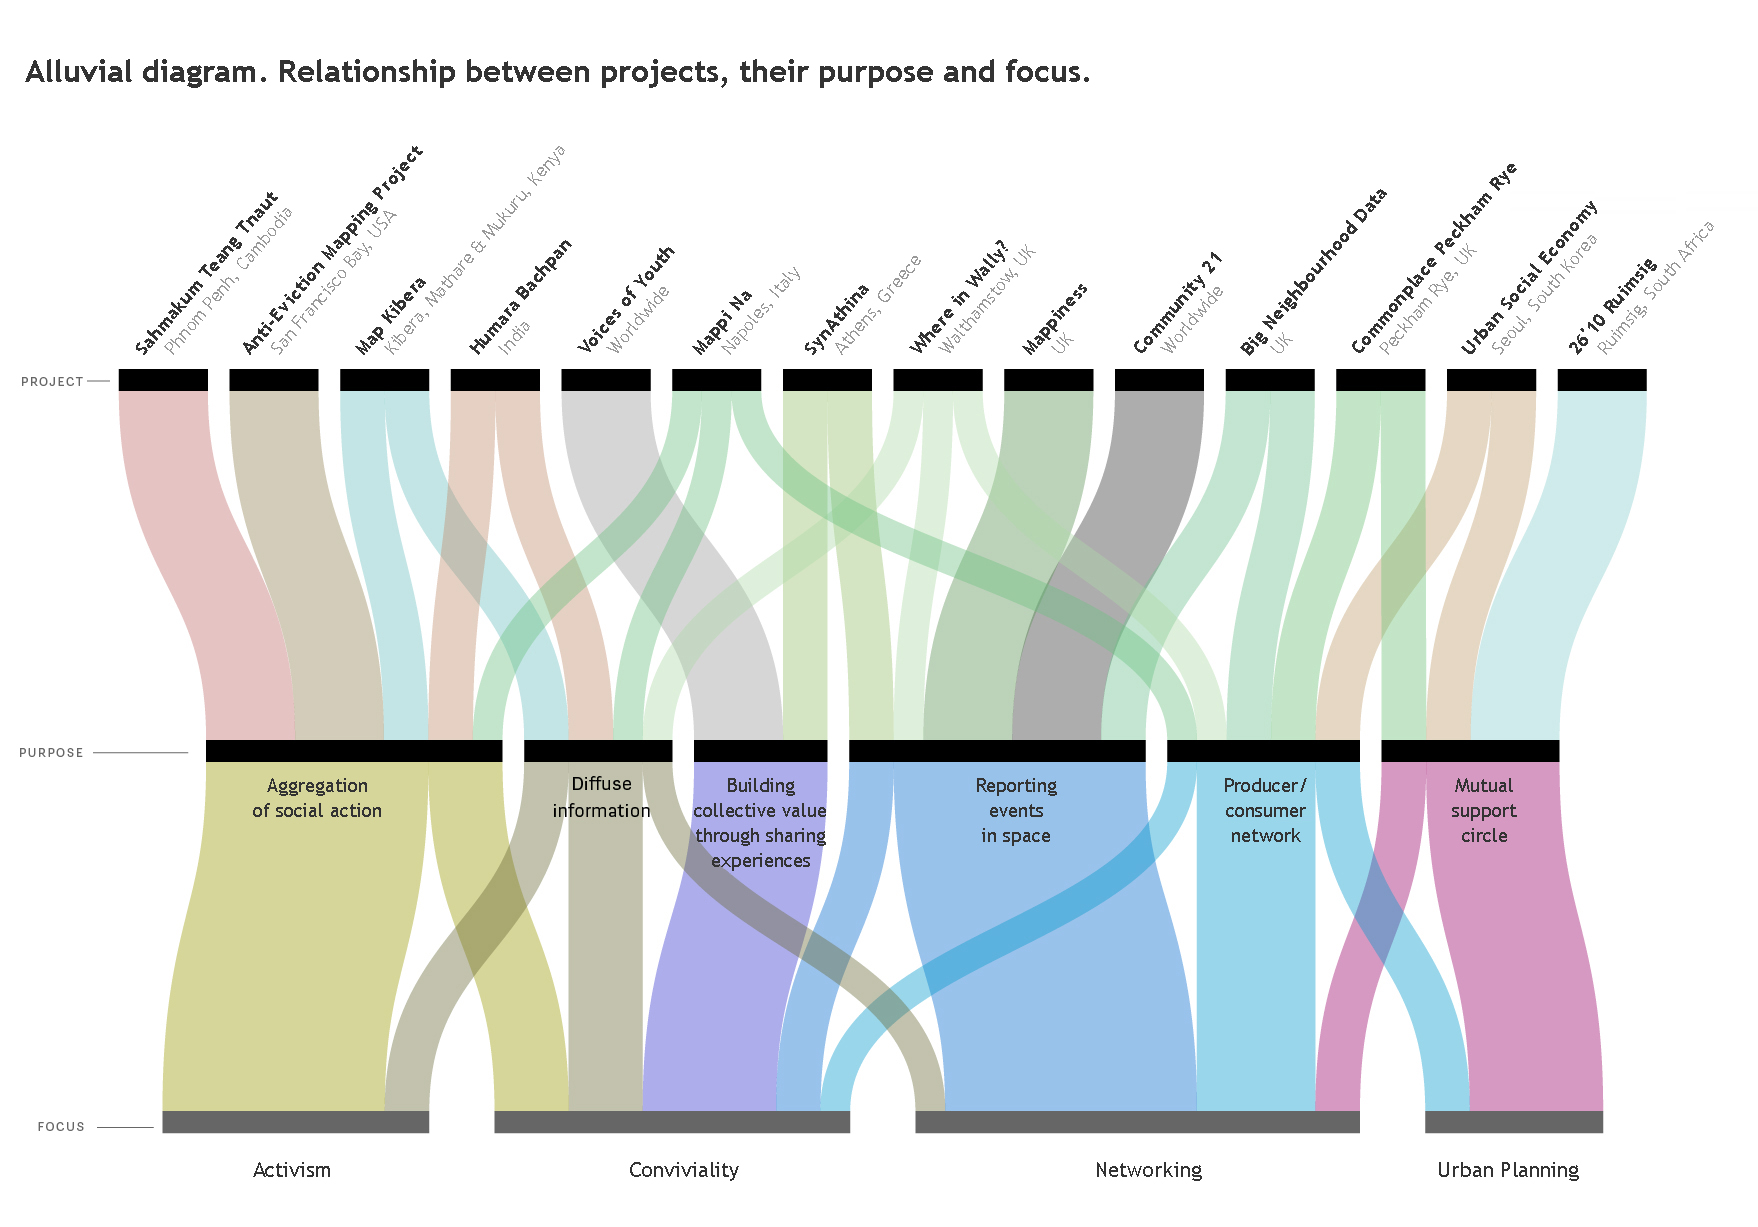
Alluvian Diagram made with Raw, software developed by Density Design Research Lab, Politecnico di Milano. www.raw.densitydesign.org
The internet has transformed communications and networks across the globe - allowing for interconnectivity and scalability of information among and between different groups of society. This allows voices, regardless of their location, to be amplified and listened to by many other voices achieving collective goals. This has great potential in a global world where it is evident that top-down initiatives are not enough to handle many of the social needs that local people experience. However, though the internet makes sharing and collaborating between people easier, offline maps are still valuable, as shown in some of our examples.
What are social digital tools?
The similarity between the different maps that we explored is that they are social digital tools. They are social because they are related to projects that are seeking to solve social needs; and they are digital because they are based on digital platforms that permit them to be alive, spread, shared and used. These characteristics also refer to their function and design.
A tool can be defined as a device or implement, especially one held in the hand, used to carry out a particular function[1]. So when we speak of a tool there are four things involved: an actor, an object, a function and a purpose. Just as a hammer is a tool that a carpenter (actor) use to hammer nails (function) and thus build something (purpose) we understand that social tools are used by one or more people for taking actions where the final objective is to meet a social need.
The four variables (actor, object/ tool, function and purpose) vary in the cases collected because they are as diverse as the contexts in which it is framed. For example in the Mappiness project the team (actors) who started it came from the academic sphere; they are calling on residents in the UK (second actors) to use the app (tool) and tag their mood in specific places of UK (function) in order to see people´s happiness and their local environment (purpose).
However, not all participatory mapping is digital. A very different example from South Africa is 26´10 Ruimsig where the actors that started the project are a complex and diverse group (an architect studio, a cultural foundation, an NGO, a university and a group of students of architecture); the second actors involved are the residents of Ruimsig who were invited to map their needs and routines (function) in order to find the best way to reblock and rebuild their houses, to achieve better conditions and to expore possibilities for resident construction (purpose). In this case, participatory mapping was not done through digital tools or by individuals; it was a collaborative and collective process that was mainly led by the actors who conceived the project, legitimated by the residents as experts of their own living situation.[2] The transfer between residents' experiences and the architects’ knowledge was possible through workshops, collective revisions and field visits.
Both the Mappiness and Ruimsig projects are similar in that they understand a social need through community participation in rethinking and locating perspectives, visualized through maps. In these two cases, both kinds of mapping invite communities to identify and recognize their experience in a geo-location. The identification with a specific point in the map is what engages people with the collective social need.
How do social digital maps work?
When looking at these mapping examples, it is important to identify the aspects that are at the core of the tools:
These aspects are directly related to the actors that participate in the mapping process and the purpose they achieve. There are two main actors, in some cases three:
Participatory mapping is based on trust and collaboration, like many other social initiatives. Local people know their areas and social needs best, and may give their time and knowledge freely for these kinds of projects. The risk for local participants is that their collective intelligence is taken advantage of, for example where solutions developed locally by local people are taken and sold for profit. The outputs of participatory mapping can provide valuable information for companies that want to reach clients or to create business. There are questions about how to protect local and collaborative information while openly sharing it.
The Anti Eviction Maps is an example of activist mapping: the purposeis not only to engage local communities and to understand how evictions are taking place, but to explicitly change policies affecting the city. Our examples demonstrate that maps and the act of mapping can pursue a diverse range of social needs, have different purposes, with different focuses.
The is diagram shows these different relationships between projects, their purpose and focus. It maps the examples to the key focus areas that were repeated within our 14 examples: activism, conviviality, networking and urban planning.
The visual elements of social digital maps
Visually, most of the examples use cartographic maps as the main element or base. However, in most of the cases the cartographic map base works together with other tools like pictures, text comments, personalized icons and color-coded tags. The available visual interfaces of cartographic bases vary, mainly depending on the possibility to edit them, availability and access.
We see that digital participatory mapping often uses existing cartographic bases that are standardized and work in synchrony with other applications. Mapping participants and those who are interested in the results may be more at ease with maps that they already know and use. To make both the process and the results as accessible as possible, it is important to represent space with visual logics with which are already familiar.
But what are the differences in cartographic bases? The most relevant is the possibility of editing, contribution and its free use. Google Maps is a popular API (Application Program Interface) for mapping, offering many usability possibilities (for example, flexibility across different devices), but is not an open source map like OSM (OpenStreetMap.org) that gives the possibility to edit the base map itself. Map Kibera used OSM: people involved in the project were able to freely measure and upload the cartography of Kibera contributing new knowledge to their community and to the world.
Finally, we see map applications developed with programming language. These maps use style libraries that permit the developer to combine more visual variables and elements such as icons, style labels, chromatic palettes and fonts among other visual variables (see the Diagram of Visual Variables below). For example the 28 maps available through the website of the Anti-Eviction Mapping Project were developed based on OSM in combination with Leaflet, D3 and CartoDB. These maps have a range of diverse combinations in their visual variables and interfaces related to the topics they represent.
The cartographer Jacques Bertin said the problems of modern cartography are not related to the accuracy of the measures but centre on the graphic transcription of the data. Misleading icons, or the use of a wrong colour palette, can change the meaning of the data represented on a map. The job of a cartographer is to control and represent the data through the different visual variables so the user can read it clearly. The visual definition of the elements with which non-experts are going to interact is key.
Diagram of Visual Variables
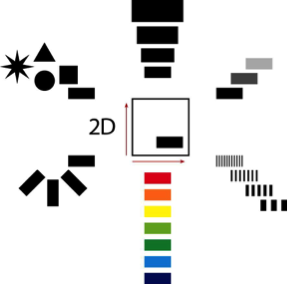
Diagram of visual variables: , Jacques Bertin, 1973 in Sèmiologie graphique. Position, shape, size, contrast, texture, colour and orientation. Each visual element (such as icons and labels etc. in the case of maps) is subjected to these variables. They must be designed considering the outcome of the final set of all the data on a map.
Through the personalization of the visual elements used on maps, it is possible to enhance the engagement and insights of the participants and the community. A good example is the Where in Wally? project where the customisation of the tag point (the Wally icon) enriches the storytelling of the whole project. People can easily navigate the Google Maps interface but what makes them realise that they are not just on a Google Map is the tag point, reminding you that you are tagging “Wally”.
Even though default platforms only supply a limited number of elements to combine and customise, these maps can be complemented with other tools and platforms that make them unique and contextualized to the cultural background of the project. Mappi Na invites the community to post and upload to their website pictures and sounds from Naples. The maps are complemented with Soundcloud players and images. The platform allows people to easily upload and share their perspectives of Naples, adding a individual narratives beyond the spatial map.
The cause
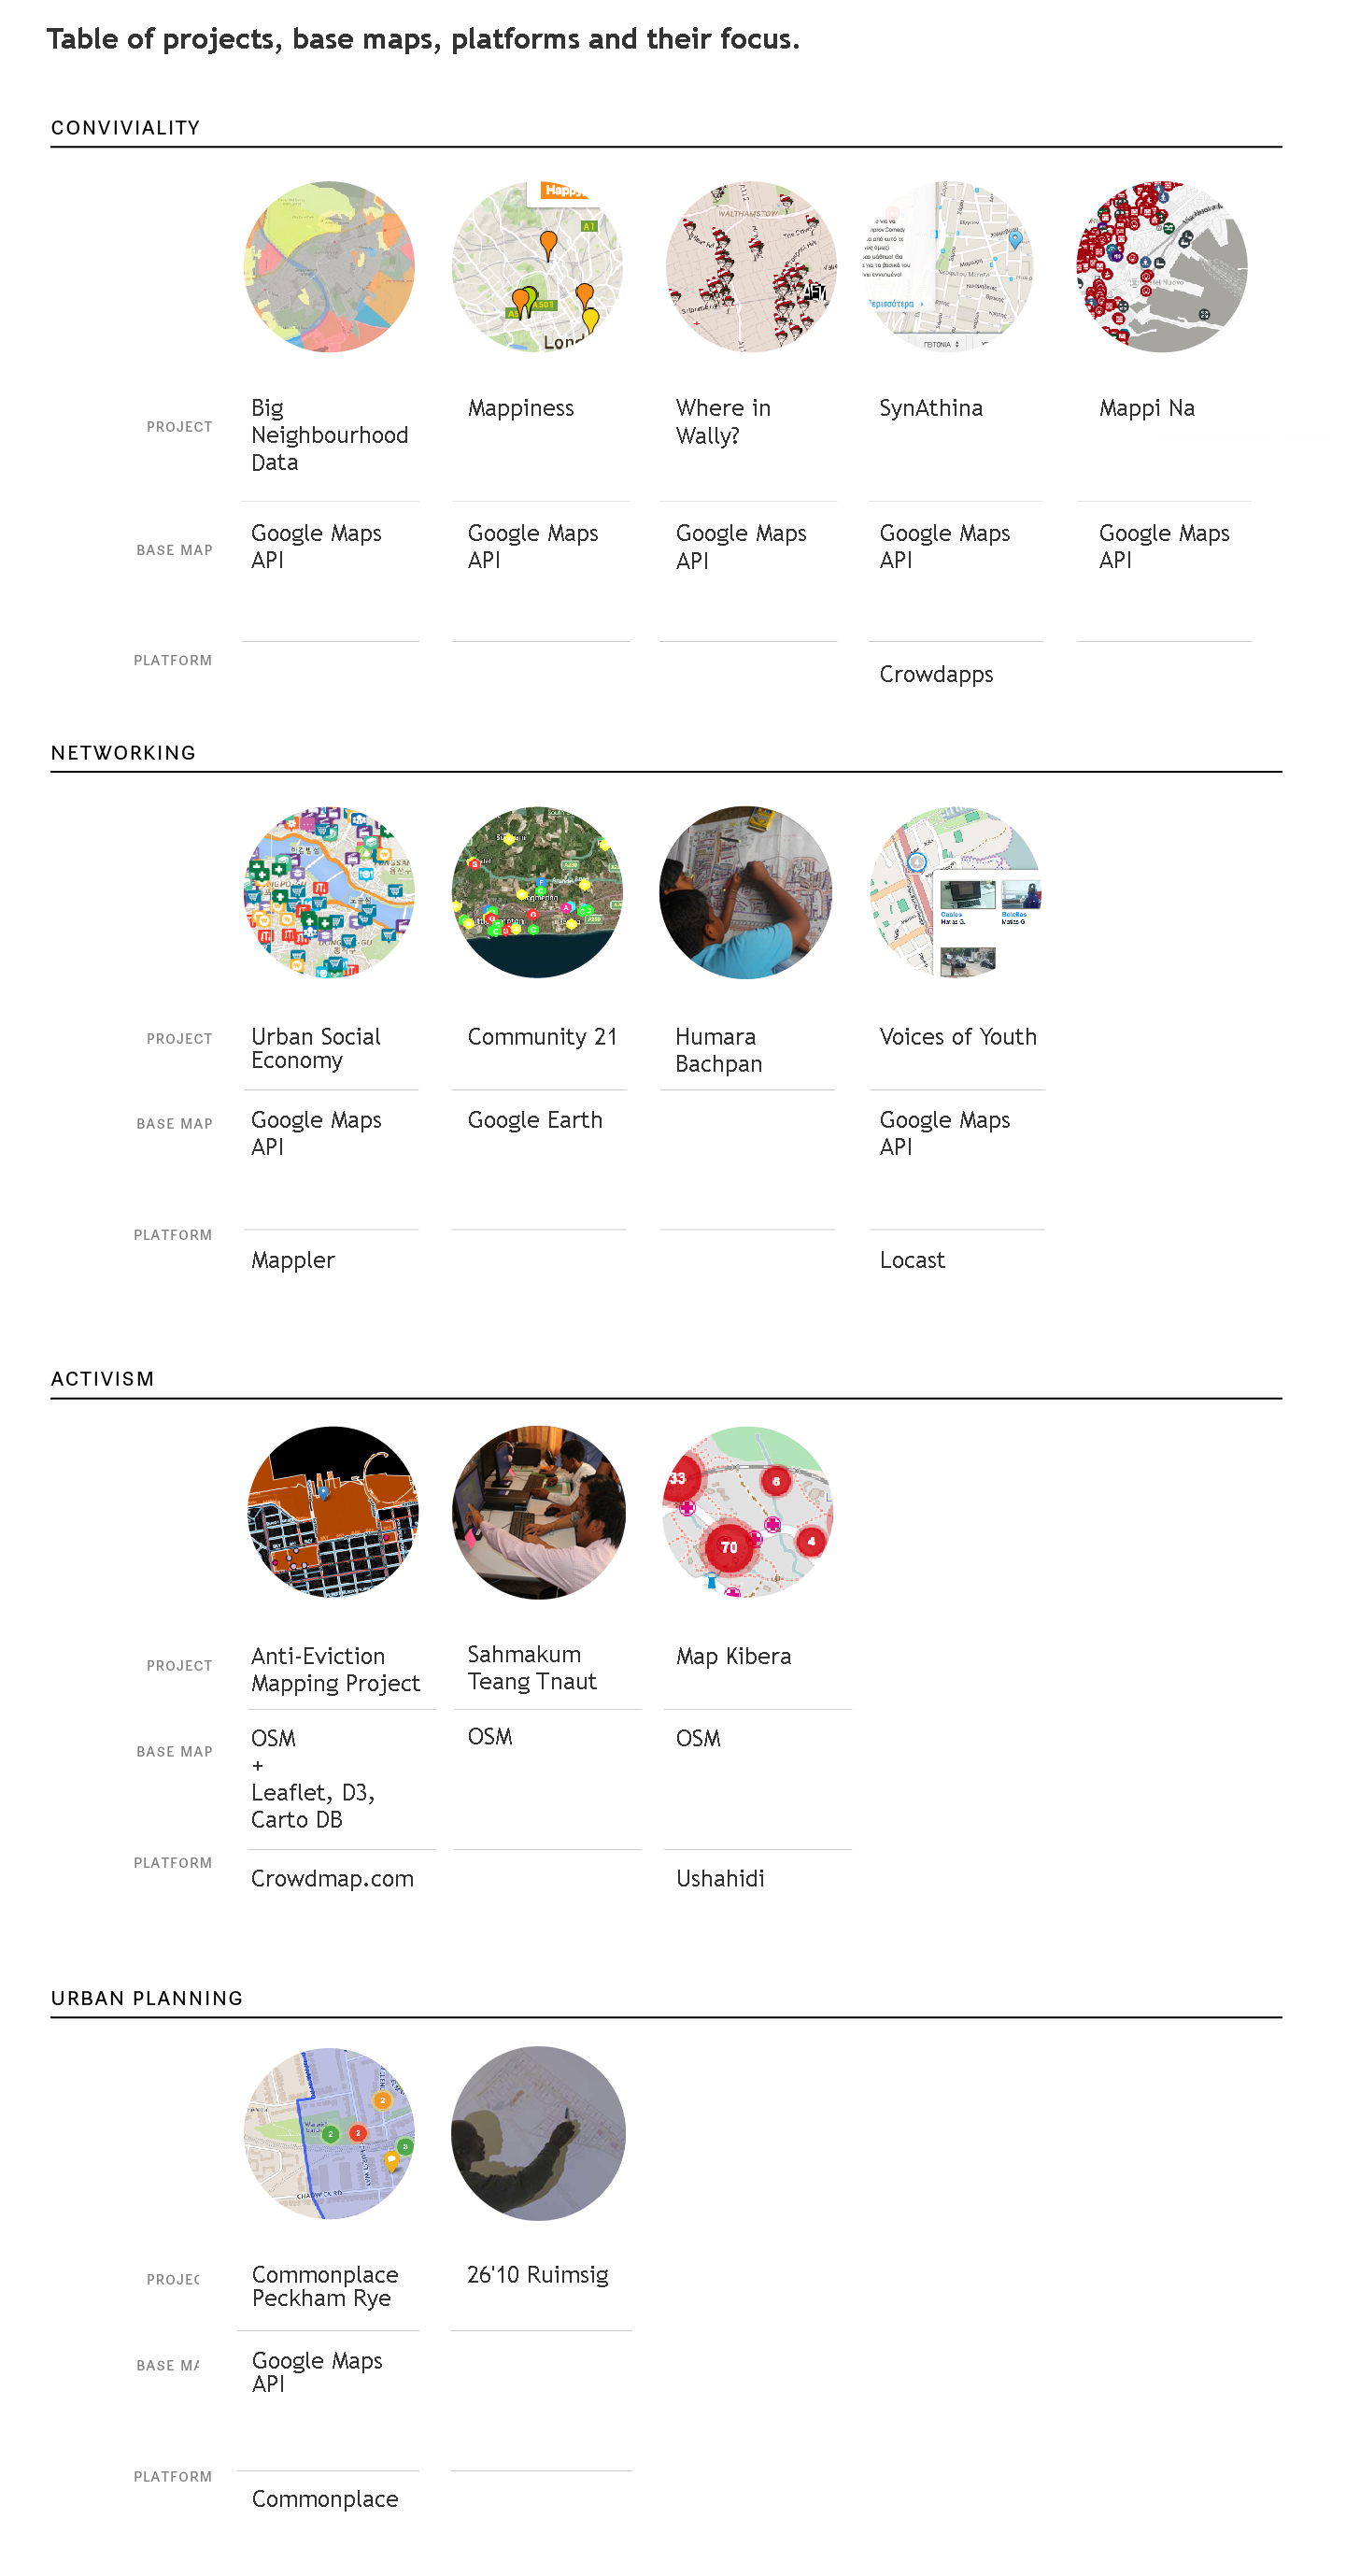
The visualization and tools used in participatory mapping can reflect or match the motivations behind the map. The following table shows the relationship between the technologies, maps and focus of our case studies. Projects that focus on activism often work on Open Street Map instead of Google Maps. This matches activism discourse with open source tools that have no “limits”, and are not linked to a private company. On the other hand, projects with a conviviality focus often uses Google Maps as it offers an interface more familiar to a wide range of users. This is valuable where a project wants to engage a new community already familiar with online maps and introduce it to mapping.
So how might mapping offer new insights on peoples’ experience?
Mapping can be an effective tool for engaging communities and for giving new insights to people related to their social needs, but they are part of a bigger and complex collaborative dynamics.
The 14 maps we looked at were: