

This is the first in a series of four blogs exploring our work with Hounslow Council to develop a new model for measuring community resilience.
How do we understand the intangible capacities, strengths and vulnerabilities within local communities that support people to cope and move on when things go wrong?
Our understanding of what makes local communities resilient is growing, with international insights from Rockefeller Foundation’s 100 Resilience Cities, and the World Heath Organisation helping us develop a practical understanding of resilience this can be measured.
Social Life’s work on resilience flows from the assumption that neighbourhoods that thrive do so because of their local assets and social wealth. And that these factors are important in supporting people from all backgrounds, particularly those who are vulnerable and disadvantaged. WHO describes resilience as “the ability of communities and groups to adapt and thrive in response to external stressors."
In the same way that some individuals find it easier to deal with life’s difficulties, and bounce back in the face of problems that may stop others in their tracks, some places have over time proved more resilient to shocks and downturns than others.
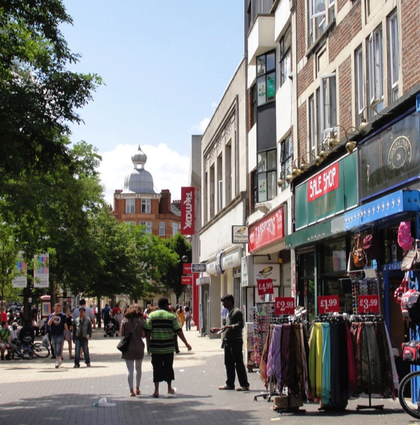
Social Life has been working with Hounslow Council for the last few years, exploring how we can use local data to build a picture of resilience at the very local level. We wanted to understand what is supporting Hounslow’s local communities, looking at the experience of hyper-diverse central Hounslow as well as more disadvantaged areas in Feltham and affluent neighbourhoods in Chiswick.
Our work grew out of the Wellbeing and Resilience Model – or WARM. One of the roots of Social Life's work is the Young Foudantion's past work on wellbeing and resilience. For our work with Hounslow we refined the analysis and updated the data, but the aims remained the same:
“… to provide a way of bringing together existing and new data to help communities make sense of their choices. We particularly wanted to develop an approach that could analyse assets – the things that make communities work – as well as deficits. And we wanted a method that could help local areas compare themselves not to national or regional averages, but rather to other areas similar to them.” Geoff Mulgan, preface to 2012 WARM report
For Hounslow Council, the ambition was to understand the ability of communities to cope with change. They wanted to see if there was a way to capture the social capital the communities hold. Their key assumption is that resilience, the ability to bounce back, makes people less reliant on services.
Our model brings together two types of data: data predicting how an area will score on different “resilience clusters” and actual data from services or from government that describe a place.
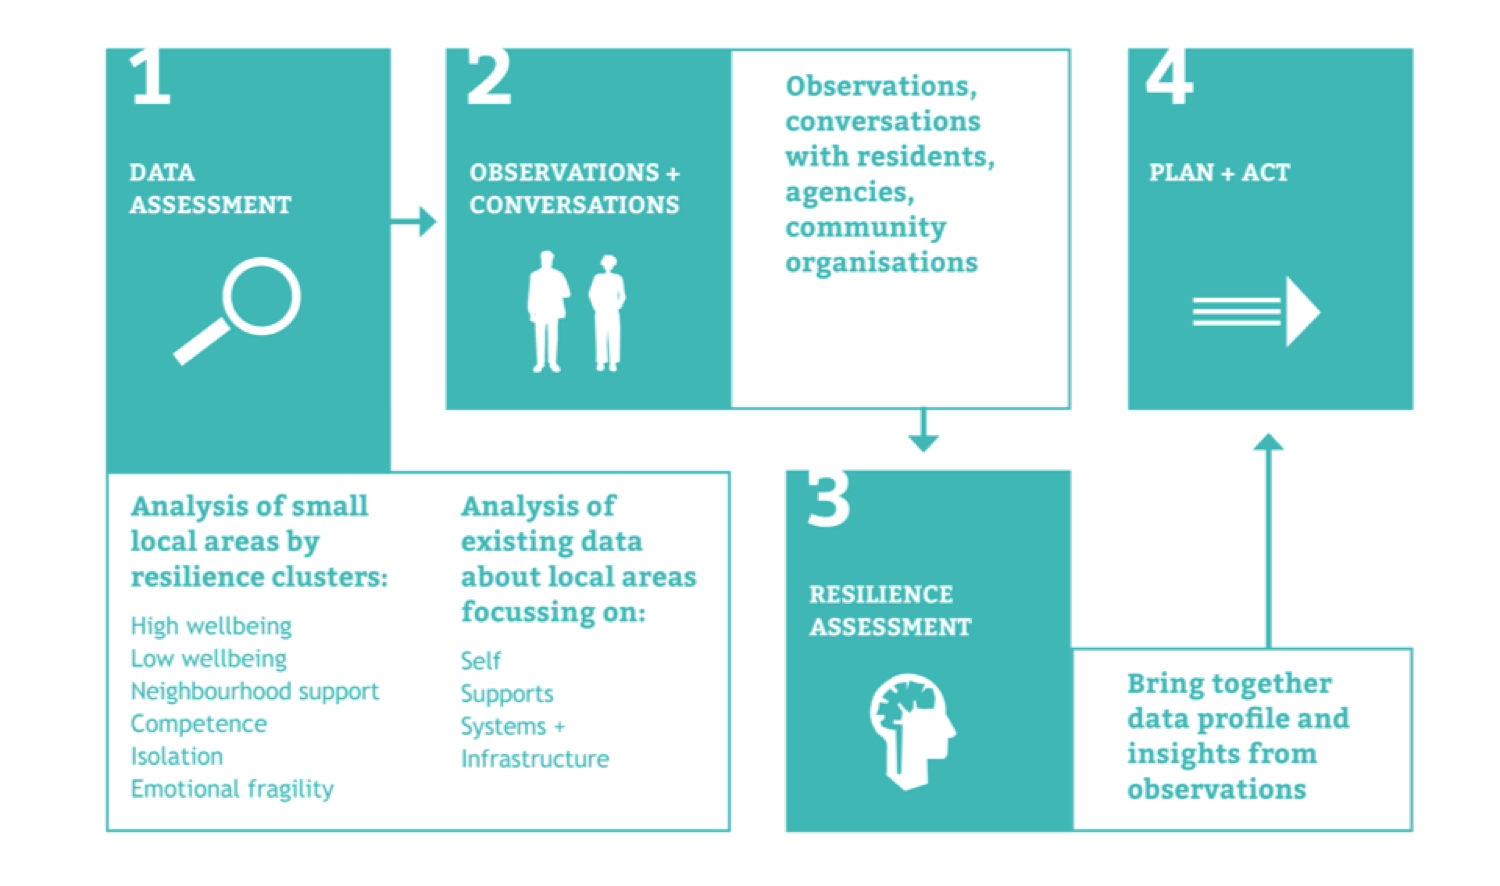
Our resilience model: the process
The resilience clusters were created through a cluster and factor analysis of Understanding Society data – the UK’s largest longitudinal dataset. These were then mapped to small local areas, using ONS' Output Area Classifications so we could visualise where concentrations of people with different characteristics live. The detail about this method is in the appendix to our report. Our resilience clusters are:
The resilience clusters help us understand spatially how different areas are likely to cope with different events and needs, and to reveal where are assets within local communities - particularly neighbourliness, competence and wellbeing - which are supporting residents to thrive.
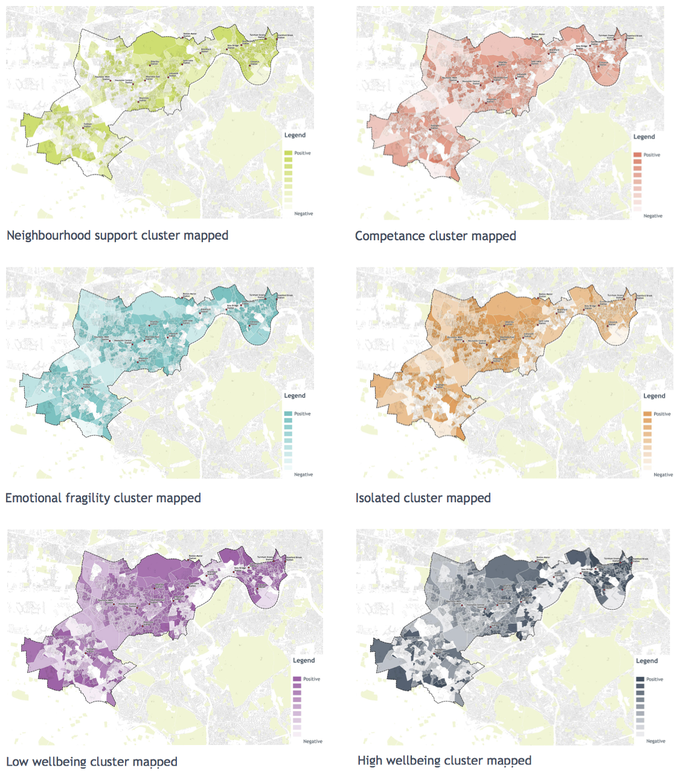
Predictive clusters mapped to Hounslow
If our predictive data - the resilience clusters - is then tested against actual data, it becomes possible to identify places with particular vulnerabilities and assets that may go under the radar of traditional assessments. For example we can see the areas that are doing well in terms of actual data, in spite of fragilities in predicted resilience; or the areas where resilience is predicted to be strong but where residents' lives (a revealed in actual data) are still difficult. This analysis provides the opportunity for local authorities and other public sector agencies to make best use of their limited resources to accurately target services to the areas that need it most.
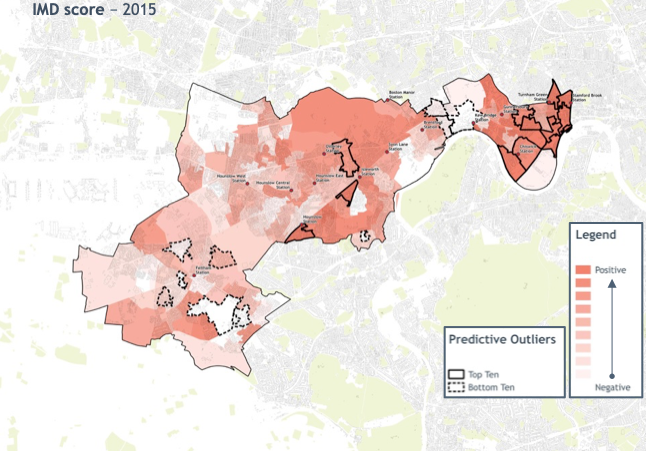
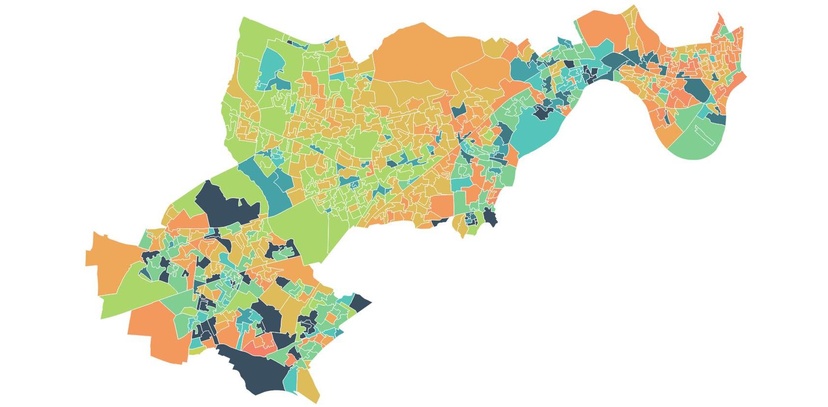
This map shows the predictive outliers and IMD scores, showing a complex relationship.
The strongest predictive outliers - indicating high potential resilience - tend to be in areas that are more affluent. However the weaker outliers fall in areas of varying deprivaiton. Some are areas with both highest and lowest IMD scores also have predicted resilience that is closer to average.
Hounslow have found the model helpful in adding another layer of insight to their understanding of the borough. It has given them a way of flagging where there may be specific local issues, existing under the radar of conventional data.
Our next blog describes what emerged when we looked at change over time in the way that resilience clusters are distributed across Hounslow.