

Mapping is becoming increasingly popular as a method in engaging local communities and of surfacing the assets that exist in local areas. Maps are being used by councils, community organisations and residents to understand local neighbourhoods and to develop ideas about how to make them work better.
We have recently created an asset map of the area around the proposed new development site at the west end of the Lea Bridge Road, as part of our “People Shaping Places” project for Waltham Forest Council with Kaizen Partnership.
We often use asset maps in our projects because of their dual qualities: they reveal gaps in the provision of community services and facilities; and also visualise what is considered valuable in an area.
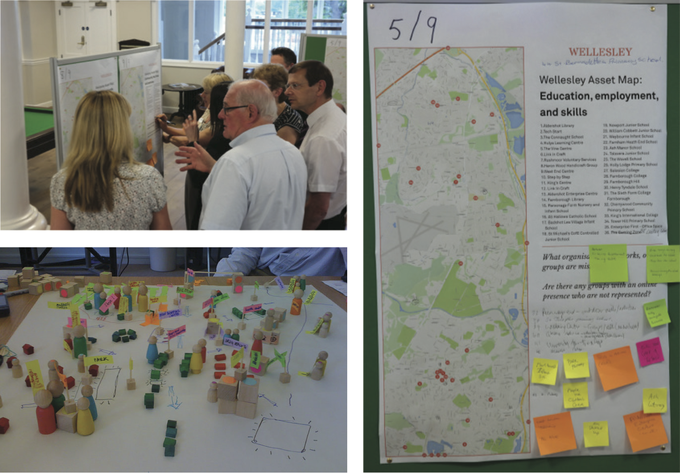
Asset mapping workshops in Aldershot in 2015, photos top left and right by Social Life, photo bottom left by Gayle Rice
Asset maps reveal different perspectives showing what services people most use in an area and what is missing. An asset map is an object, which goes beyond the regular neighbourhood map. It registers the social life of a place and can bring forth less tangible community resources, making it a useful supplement for both developers and local communities in neighbourhood planning processes.
A Google search can reveal a lot, but it leave out more informal services or services without an online presence. However, an asset map does not seek to register all available resources. To do so would be an almost impossible task – the key question is not how many places there are but what people use. Missing out key assets can be avoided by involving the local community in creating the map, including inputs from a variety of sources can give a holistic understanding of an area and point out the most relevant places.
Involvement can range from conversations and interviews, to more participatory processes with workshops. Testing the map on local people (residents, stakeholders, traders, community organisations) throughout the process can show if some assets are given too much or too little weight, or if something is missing. The result is an inventory of the resources and offerings currently available in the area. An asset map can also able to show local skills, groups and online resources, which do not depend on a geographical location.
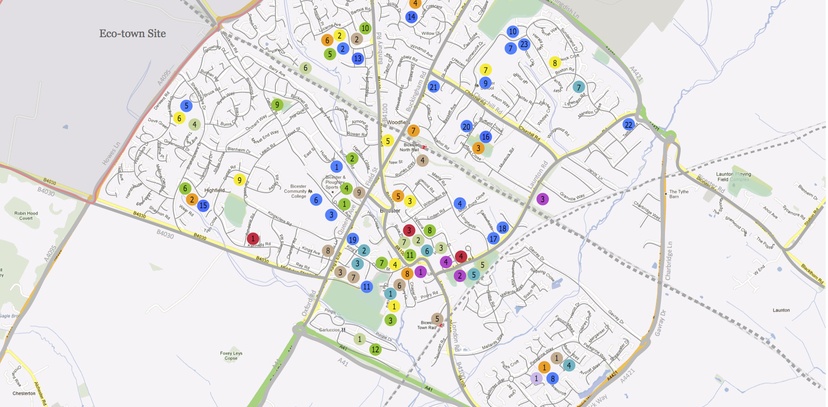
Lea Bridge Asset Map (Social Life 2016)
For our work in the Lea Bridge area, residents, traders, community groups and other local organisations were asked about which facilities and services they most use in the area and they feel is not currently offered.
We found that the mosque, churches, parks, library, local shops, pub, and youth clubs were identified as the most valued assets in the area. One youth club, one church and one pub were cited as the most commonly used local community resources. Other places like cafés, gyms, and shops were mentioned as key places where residents interact daily with one another.
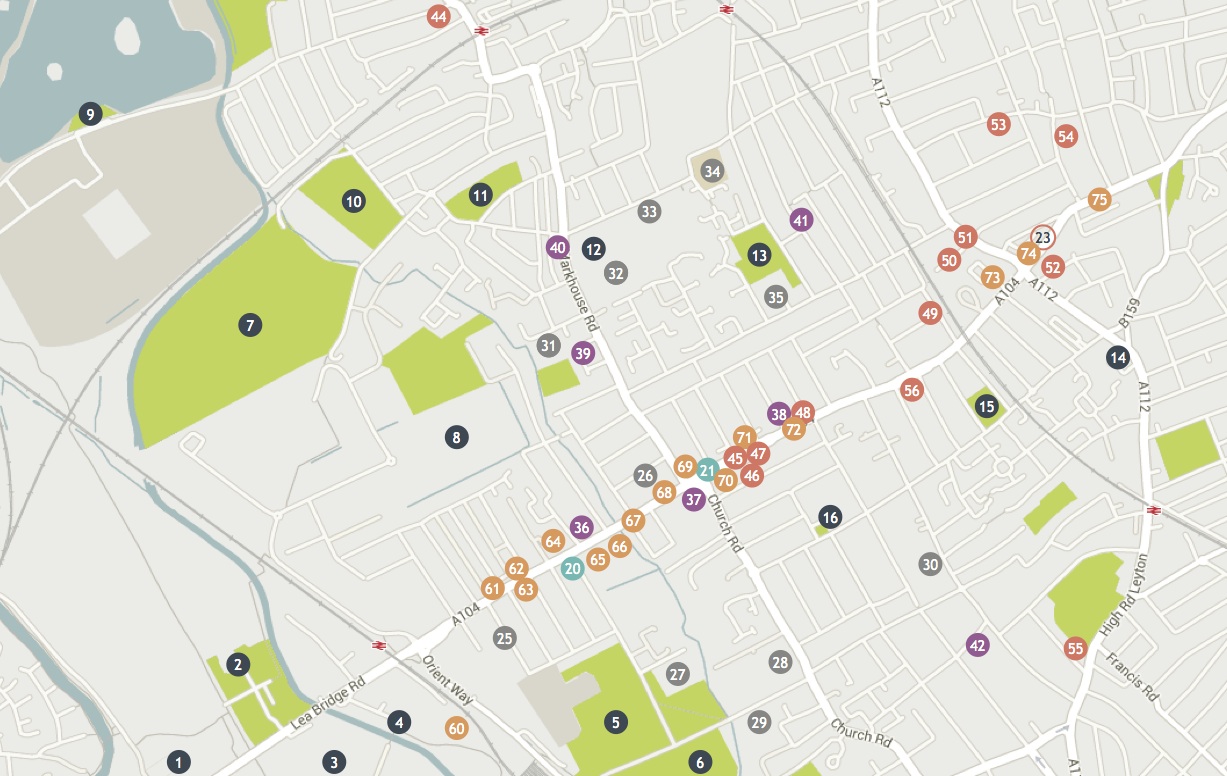
 An
An
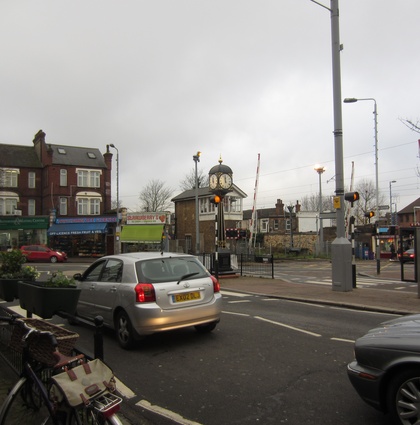
The Clapton end of the Lea Bridge Road
An asset map is a useful supplement to more conventional local planning processes. It can help developers understand the networks and social life of an area. It can also help communities engage with one another, and discover a valuable supply of local resources. Additionally it can help communities to develop a stronger voice and greater confidence to engage in political processes and negotiate the future of their local area. An asset map in itself cannot solve disagreements, but it can help to a more inclusive process and bridge potential misunderstandings between developers and communities.
The final output of this project was a toolkit - engage-wf.net - to help officers and councilors in Waltham Forest become more confident in engaging residents.
Links
For an example of how we have used asset mapping see the Lea Bridge People Shaping Places report.
For a more detailed description of what a method for asset mapping can look like see here.
IECD and Carnegie UK Trust have written a report about “Appreciating Assets” highlighting different methods and providing a range of case studies:
Openplans gives suggestions for different platforms for giving inputs via maps: http://blog.openplans.org/2014/12/21299/
Community Research lab created an Participatory Assetmapping toolkit in 2012, see: http://www.communityscience.com/knowledge4equity/AssetMappingToolkit.pdf
Social Life created an Atlas of Social Maps in 2015.