
Social Life developed our Community Dynamics data - predicting how people feel about the places they live - over a decade ago. We’ve used it in social impact assessments and neighbourhood portraits. We believe the data and the approach have fresh relevance today, shining a new light on the challenges communities are facing, supporting rooted and empathetic policy responses that fit neighbourhoods’ unique circumstances.
Social cohesion, belonging and neighbourhood quality have become urgent topics, as fracturing community cohesion generates increasing concern and debate. Agencies delivering services, government at different levels and local communities urgently need better ways of understanding the social life of places at the very local level, to help them make better local policies, to direct investment and address challenges.
Community Dynamics mirrors metrics in the government's Local Outcomes Framework - including neighbourliness, safety and loneliness - and in other local data frameworks. The unique strengths of Community Dynamics lies in the range of indiators we can map, the focus on very small local areas (smaller than wards or LSOAs) and in its capacity to map change over time.
What is Community Dynamics?
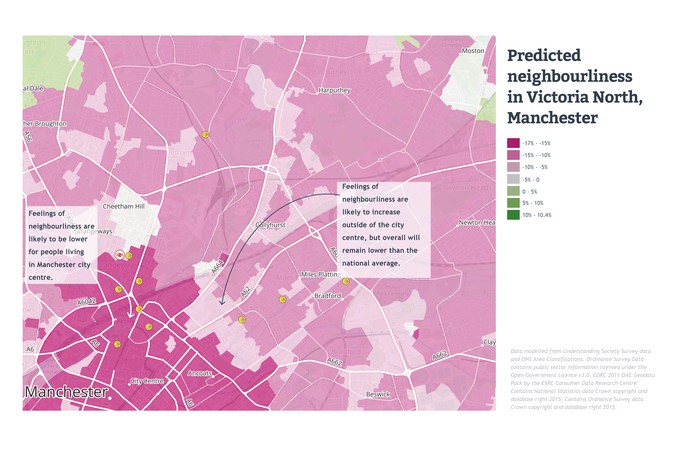
Community Dynamics predicts how people are likely to feel about their local neighbourhoods - their sense of belonging, safety, agency, and how they feel about their neighbours. It’s difficult to get data on neighbourhood perceptions without extensive and expensive research - but this data is invaluable for communities and agencies in neighbourhoods that are in need of investment or are being radically changed by regeneration or new housing development.
Social Life has used Community Dynamics as a tool for over ten years. It helps us contextualise our research and understand what the strengths are in local communities. Knowing the percentage of people in an area who feel positive about their neighbourhoods is useful - but what we really need to know is whether this is what we’d expect - how does it compare to the national average? And even more useful is how does it compare to similar areas - how people feel about their community in small isolated village is likely to be very different to people living in a dense inner-city neighbourhood.
Community Dynamics models national data from surveys backed by government and the research councils matched to ONS area classifications. It cannot paint an accurate picture of the detail of neighbourhood feelings, to do this primary research is needed. Its strength is in understanding trends and patterns. We've found it particularly useful to set it alongside other types of hyper-local data, from the IMD or the census.
What can it tell us?
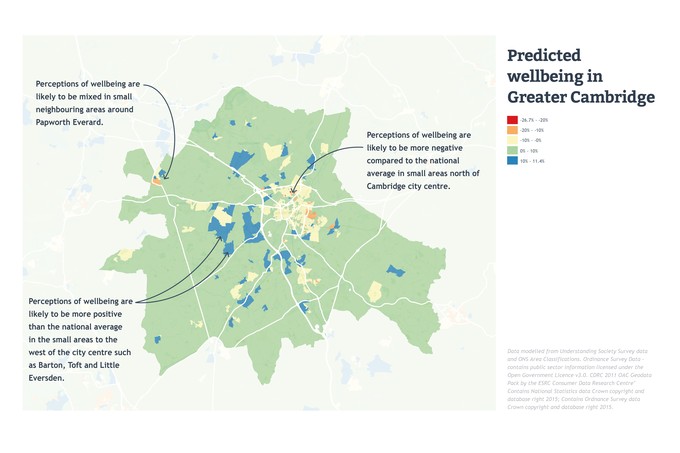
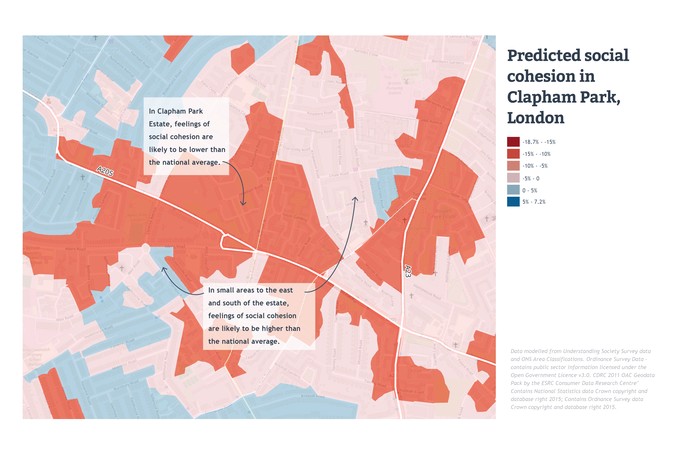
Community Dynamics can identify where wellbeing - a strong protective factor - is strong or weak, and where loneliness and financial precarity are likely to be concentrated. It highlights where belonging is strong - or under pressure - and where fear of crime (often different to actual crime) is likely to be concentrated.
The data has direct relevance to current debates and policy priorities. It can reveal neighbourliness, social cohesion and trust - critical parts of social capital that are under threat across the country. It can help agencies understand where social integration is likely to be weak and where community tensions may flare.
Where have we used it?
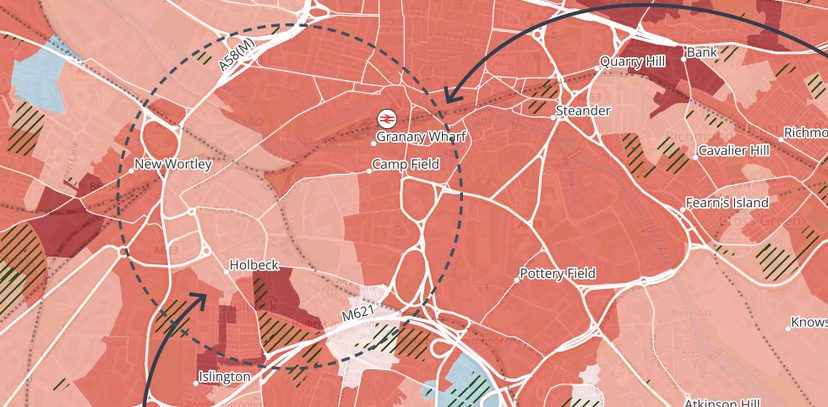
We’ve mapped community dynamics data around New Town sites to understand wellbeing, belonging and neighbourliness. A lot of resources go into economic and environmental analysis on development and regeneration sites, however the social side is often under-quantified.
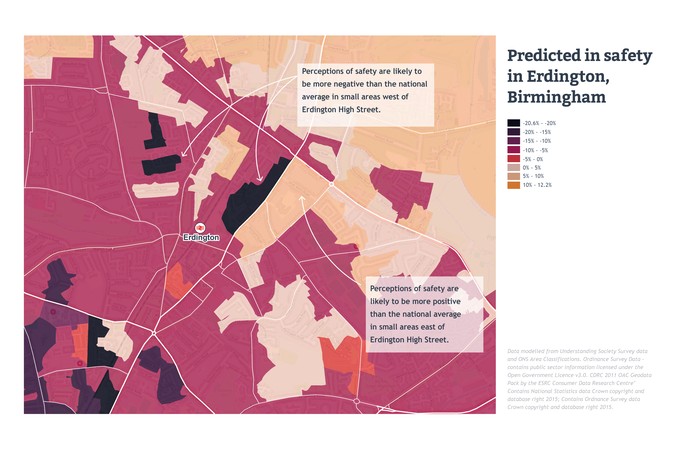
We’ve used Community Dynamics as part of a neighbourhood dashboard for Erdington High Street in north Birmingham as part of our work with Witton Lodge and the Centre for the New Midlands on our evolving Decent Neighbourhood Standard. This approach can help inform Pride in Place areas and the places that aren’t the focus of targeted regeneration investment.
Last year we used Community Dynamics to understand what data there is to reveal how social determinants of health are distributed in the south of Lewisham as part of our Sevenfields Community Health Champions project.
What’s next for Community Dynamics
We think this data has more value than just as a consultancy tool
Get in touch if you’d like to know more or work with us on this, we are actively looking for collaborators!
Download the maps we've used in this blog - if you'd like to take a closer look.