

In late 2024 and the first months of 2025 we worked in east Brimingham with Loconomy and Birmingham City Council. Our task was to map social and economic assets in three areas in the East Birmingham Inclusive Growth Strategy – the Green Innovation Quarter, Sports Quarter, and Knowledge Quarter.
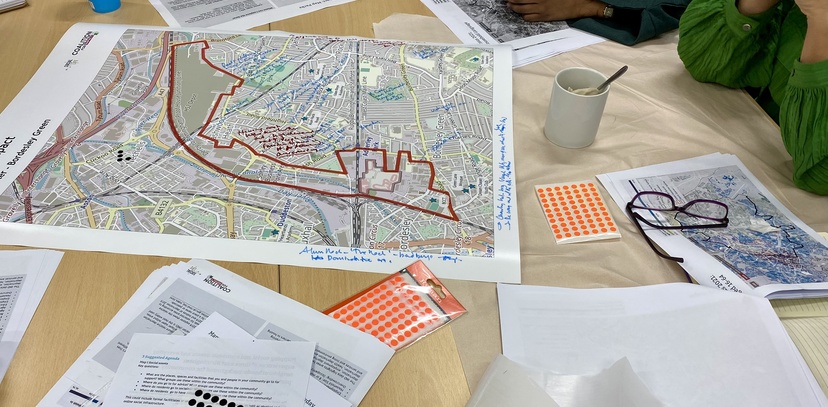
We often use participatory mapping but this is the largest scale we have worked at – across a large part of a major city, with thirteen community partners. We saw how mapping succeeded in helping people bring together their local knowledge with others and enrich and build their local understanding. We saw how working together pooling insight helped people build new relationships and think differently about the potential for collaboration. We were heartened by how willingly people engaged with our maps and how openly they gave their views.
“Mapping is highly effective in noticing – there are some things we know but when you can see it, it is different. It makes us think differently about what we a can do”
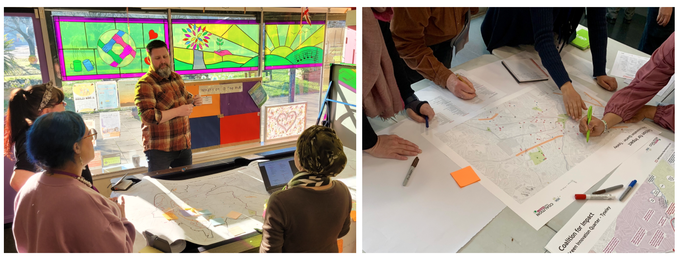
This was part of Loconomy’s Coalition for Impact programme. Thirteen community hubs were supported to take part in a collaborative learning programme. The aim was to develop investable propositions to support inclusive growth in the future.
Over 500 people fed into the community mapping through 17 community events and workshops. Our first step was to facilitate a series of asset mapping workshops with the community partners. We then gave them materials and guidance so they could carry out their own mapping in their own communities.
Why map?
Mapping assets collaboratively across organisations can reveal knowledge and insights that may be hidden. It can be useful in pooling knowledge between individuals or partners who do not regularly work together, for sparking ideas and fresh thinking and to cut across the silos and structures that can inhibit innovative thinking.
The value of mapping local assets is primarily in the process. In asking questions about where different assets are located within a neighbourhood we have an opportunity to think differently about our neighbourhoods and to learn from others with deep local knowledge.
What do we mean by assets?
We included all the supports that residents use to meet their needs, to socialise, to take part in decision making and to have influence. This includes formal assets like libraries or community centres and informal groups or online networks. We used the definition we developed in our Connective Social Infrastructure report for the Mayor of London.
“Social infrastructure covers a range of services and facilities that meet local and strategic needs and contribute towards a good quality of life, facilitating new and supporting existing relationships, encouraging participation and civic action, overcoming barriers and mitigating inequalities, and together contributing to resilient communities. Alongside more formal provision of services, there are informal networks and community support that play an important role.” Connective Social Infrastrcuture
What came out of our work
We found that the maps' strength was as an artefact to spark discussions. People disagreed and corrected or added to the maps, continuing the conversation of a different group. It enabled some institutions to dream as well as map what exists, they included planned builds and initiatives as well as their thoughts on what could happen.
Community organisations saw the mapping exercise as important to feed into planning discussions with Birmingham City Council.
"Some people were reluctant at first, they worried if they would be anonymous. We had to reassure them and explain the process"
"Young people had very different views compared to the older people and business owners"
"It was refreshing as engagement is usually a male dominated space, so [the women] felt that they could be more open and honest."
"Some struggled, we found the mapping worked with points, but less so with things that are linear or to do with areas."
Three three areas
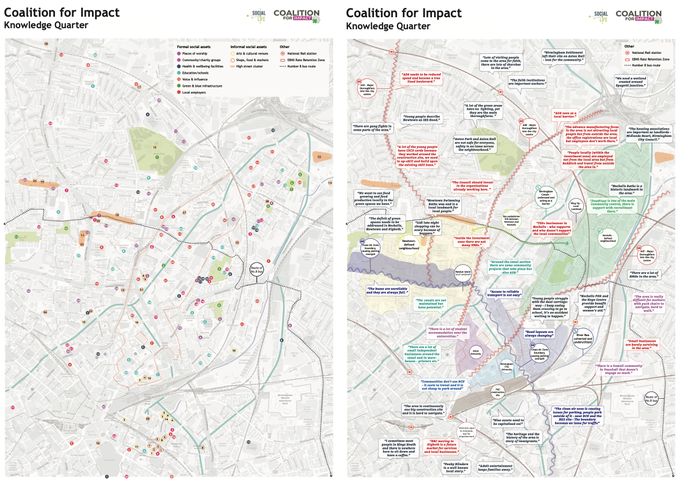
Mapping the Knowledge Quarter – defined by proximity to two Universities - showed how social assets cluster in Nechells, Newtown and Digbeth. Green and blue infrastructure are potential assets but they are disjointed and underused. Both older infrastructure (railways, major road arteries, canals and viaducts) and modern interventions (Birmingham Clear Air Zone, Hs2) dissect and sever historic communities.
“The areas feel fractured, there are distinct barriers (roads) visible on the map which separate communities”
“We’d never seen the boundary or the name of the Knowledge Quarter before this map, we are not entirely sure how it was defined.”
Mapping the Sports Quarter – around Birmingham City stadium revealed the strength of social networks within the community, but how, despite a sense of pride, the community continues to be affected and sometimes stereotyped by crime and fear of crime, poor public transport and deprivation. Mapping revealed a strong informal economy which keeps money and assets within the community. Strong self-help is an asset however it often centres around low paid insecure informal work.
“[I noticed]…..So many schools they all have sports facilities. How is the council going to give this to the community”
“Some women in our community don’t leave their homes. Their map is going to the schools, the GP, the supermarket”
Mapping the Green Innovation Quarter – around Tysely Energy Park – showed how green spaces and local waterways are important places for social connection, and identifies clusters of local employers around Tyseley and community and charity groups in Acocks Green. The map records the unknown history and strength of Tyseley’s community spaces, and it also shows the challenges the neighbourhoods face.
"Mapping out what the community groups / businesses do and where they are is very helpful. It shows there is a clear barrier between businesses and communities which needs to be broken."
“Young people went out of the map to map specific streets and were very enthusiastic about it - they’ve never been asked before about their local area”
_copy_large.jpg)
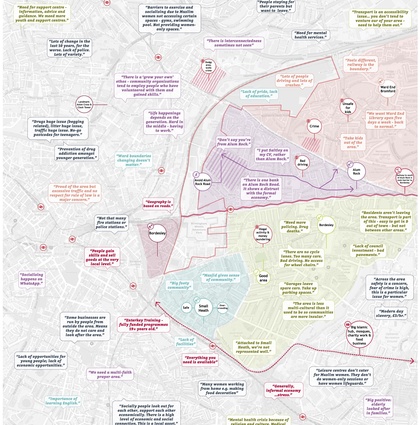
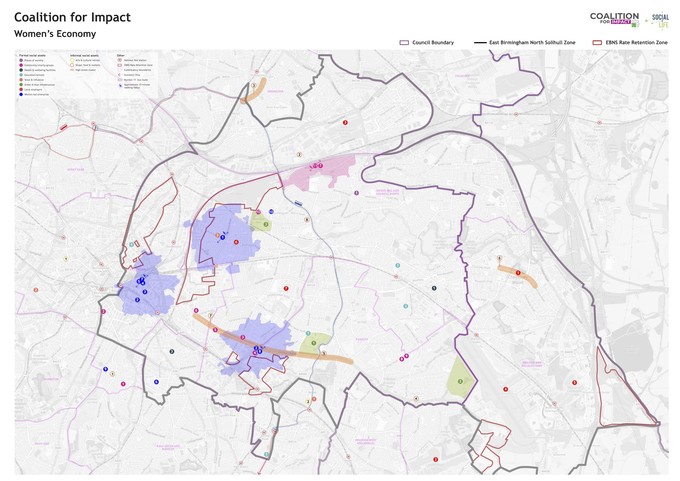
The women’s economy
Alongside this place-focused work we also mapped the women-led economy in a series of separate workshops with key women-led organisations in Birmingham. The mapping workshops focused on the wider east Birmingham region encompassing the three investment zones.
As well as capturing barriers compounding gender inequality, this map shared ideas about how to improve the region for the social and economic wellbeing for women: unlocking new investment opportunities for women-led organisations, skills and career development and improved transport. Conversations about the political and leadership landscape in east Birmingham and how it impacts women's access to the labour market emerged, with the mapping process crystallising the relationship between ward boundaries, spheres of influence and centres of local connections.
Who was involved?
We want to thank all the organisations who were part of the Coalition for Impact work for wholeheartedly embracing the mapping process: Saheli Trust, Birmingham City Community Foundation, Dream Chaser, Acocks Greener, Hay Mills Foundation Trust, Ashiana Community Project, Legacy Centre of Excellence, free@last, Initiative for Social Enterprise, Grand Union, Go-Woman! Alliance CIC, Arts in the Yard and Open Door Community Foundation.